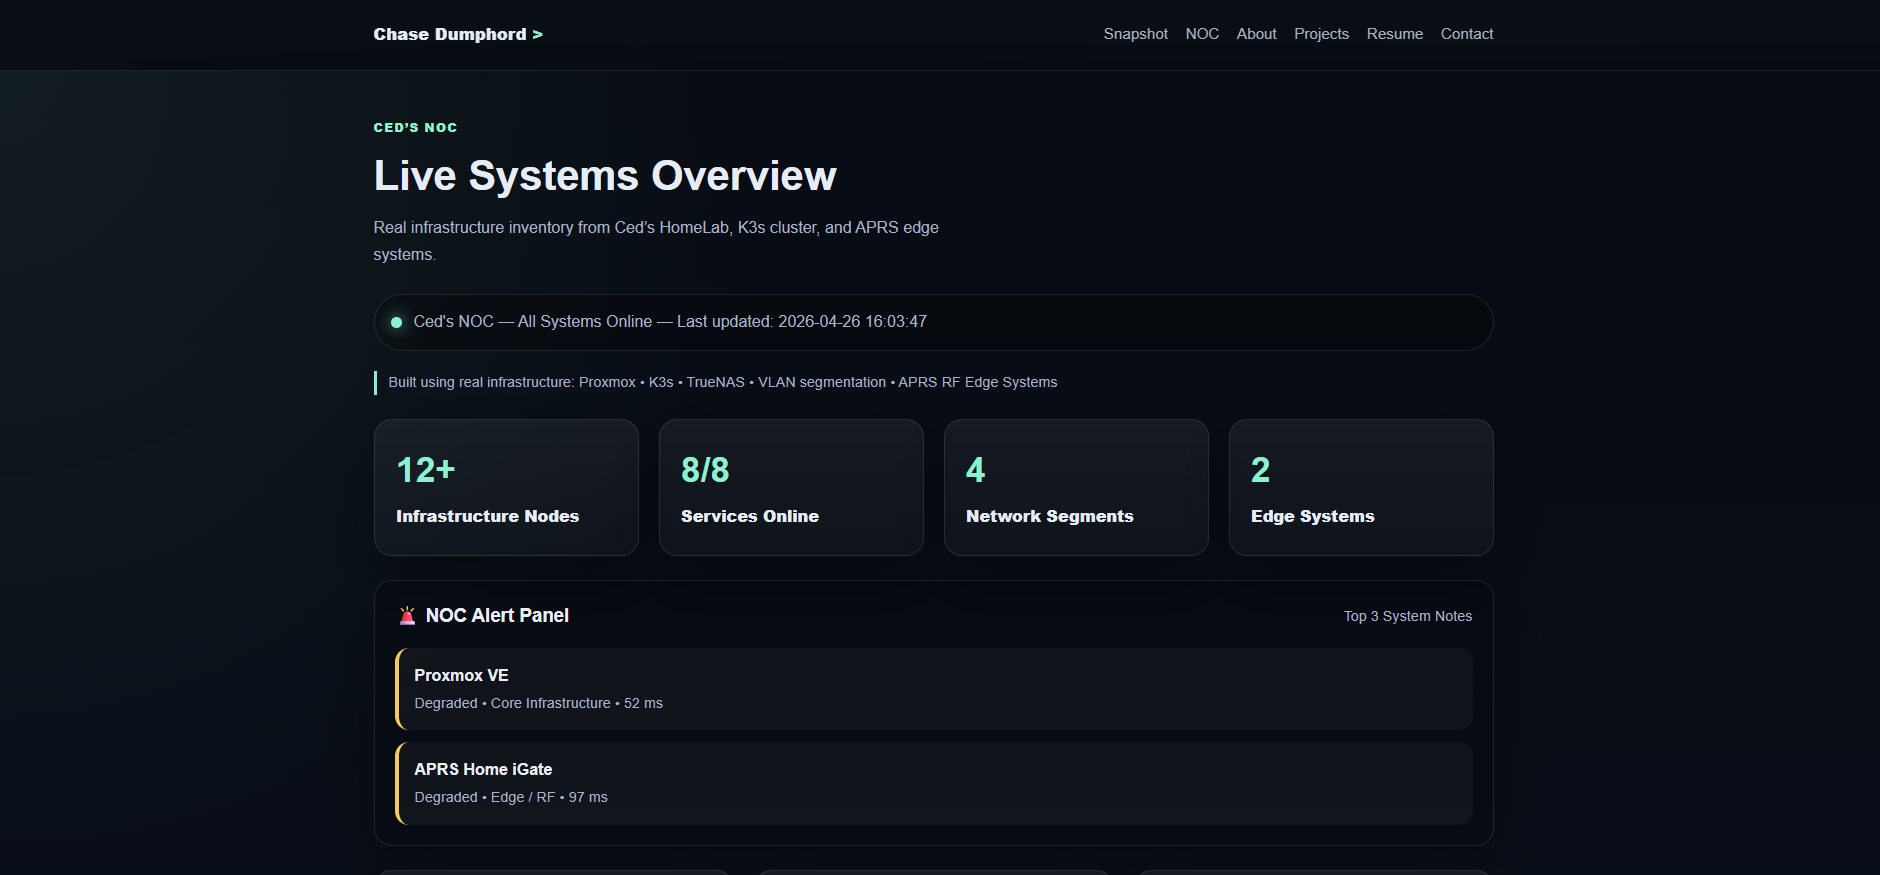
How I Built a Live NOC Dashboard for My Homelab Using Grafana + Prometheus
At some point in every homelab journey, you stop asking: “Can I host this?” And start asking: “How do I know when this thing breaks?” That question sent me down the rabbit hole of observability, monitoring, and infrastructure dashboards. Which eventually turned into something I probably took way too far a full blown Network Operations Center (NOC) dashboard for my homelab. And honestly? I regret absolutely nothing. Why I Built a NOC Dashboard When you’re running a 6-node Proxmox cluster, a 12-node Kubernetes cluster, TrueNAS storage, and a dozen self hosted services things break. Containers fail. Storage fills up. Services go offline. Networks get weird. ...