At some point in every homelab journey, you stop asking:
“Can I host this?”
And start asking:
“How do I know when this thing breaks?”
That question sent me down the rabbit hole of observability, monitoring, and infrastructure dashboards. Which eventually turned into something I probably took way too far a full blown Network Operations Center (NOC) dashboard for my homelab.
And honestly? I regret absolutely nothing.
Why I Built a NOC Dashboard
When you’re running a 6-node Proxmox cluster, a 12-node Kubernetes cluster, TrueNAS storage, and a dozen self hosted services things break. Containers fail. Storage fills up. Services go offline. Networks get weird.
I found out the hard way. One weekend I came home to find three services had been down for hours. I hadn’t noticed. That was the day I decided checking systems manually wasn’t the move.
I wanted one place to see everything. A single pane of glass. Something that felt like what you’d see in a real enterprise operations center. Something that would tell me the moment anything went wrong before users (aka me, my household) noticed.
That meant server health, CPU usage, RAM utilization, network performance, storage metrics, container health, Kubernetes node status, service uptime, and latency checks. All of it. Live.
In other words: I wanted my homelab to feel like production.
The Tech Stack
Here’s what powers the observability platform all running on a dedicated Proxmox LXC container:
Prometheus
The brain behind the metrics. Prometheus scrapes telemetry from every system across the environment and stores performance data as time series. It’s constantly asking every service:
“Hey… are you alive?”
Scrape interval: 15 seconds for most targets. Slower exporters like UniFi run at 120 seconds.
Grafana
The visual side of the operation. Dashboards, real time metrics, health indicators, graphs, status panels. All the “make me feel like I’m running a real NOC” stuff.
Three production dashboards:
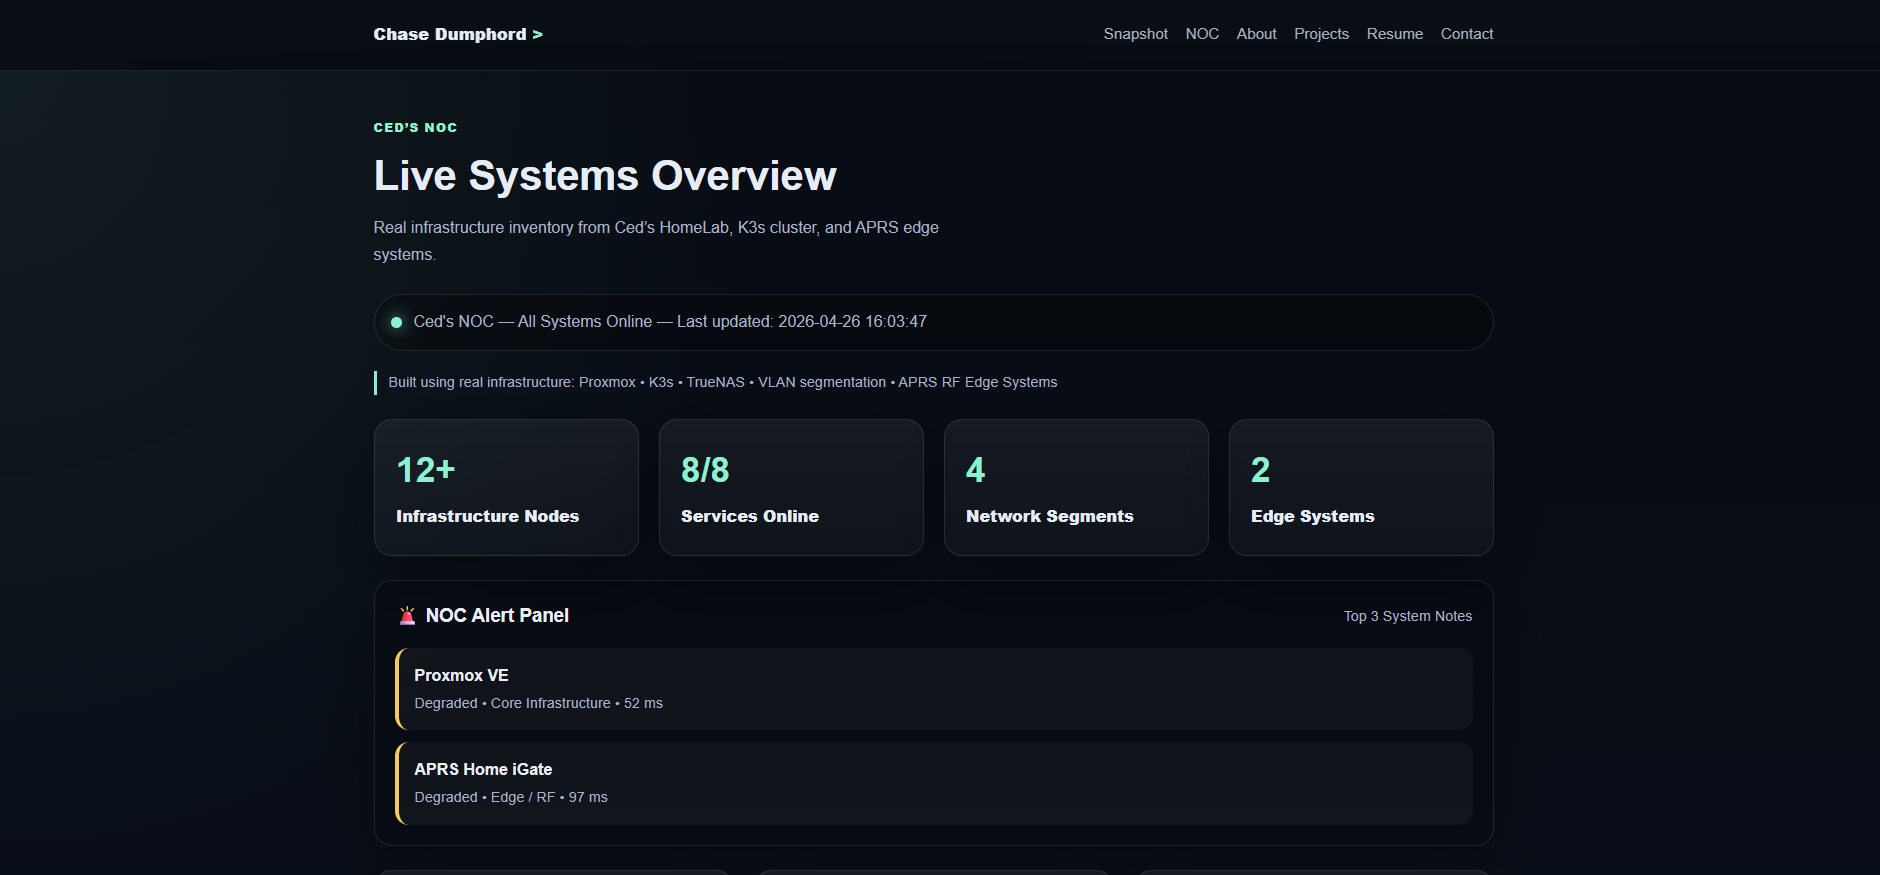
- Production Command Center v3 Executive NOC view. NOC Health Score, Core Services UP/DOWN counter, average latency, K3s nodes online, Proxmox nodes online, per service status tiles. Designed for quick status checks and let’s be honest portfolio demonstrations.
- Deep Observability v3 Full drill down for active troubleshooting. Every layer of the stack in one view.
- K3s Elite Observability v1 Dedicated Kubernetes dashboard. Node CPU, memory, pod phase by namespace, container restarts, disk usage across all 12 nodes.
The Exporter Stack
This is where most of the actual work happened. Eight exporters feed data into Prometheus:
| Exporter | What It Monitors |
|---|---|
| Node Exporter | CPU, RAM, disk, network on all 18 nodes |
| kube-state-metrics | Pod state, deployment health, replica counts |
| Proxmox Exporter | Hypervisor node status, VM health, HA state |
| Windows Exporter | PrimeStation, my main workstation |
| Blackbox Exporter | HTTP/TCP probes for service uptime and latency |
| TrueNAS Graphite Exporter | Storage pool health and dataset usage |
| Unpoller | UniFi network device metrics, client counts, throughput |
| metrics server | Real time K3s resource usage for kubectl top |
Getting all of these running cleanly took more time than building the dashboards. Each exporter has its own quirks, its own config format, and its own way of silently failing without telling you why.
What I’m Monitoring
Proxmox Cluster: 6 Nodes
Real time visibility into BigWorld, Biggie, Snoop, TooShort, Tupac, and DrDre. Host health, resource utilization, node uptime, VM and container status. When a node goes sideways I know before the VMs do.
K3s Cluster: 12 Nodes
3 control plane nodes, 9 workers split by role. Node availability, cluster performance, pod health, workload monitoring. 117+ days of continuous uptime and counting.
Network Services
Reverse proxies, Cloudflare tunnels, self hosted dashboards, monitoring services all checked continuously via Blackbox Exporter HTTP and TCP probes. Because “it works on localhost” doesn’t count.
Edge Systems
APRS iGate connectivity to the APRS-IS network. Because yes, I monitor my RF systems too.
Lessons Learned the Hard Way
Building this taught me things no tutorial covers. Here are the four that hit hardest:
1. Disk space matters more than you think
Prometheus stores metrics as time series data on disk. My initial Proxmox container was 3.86GB. After a few weeks of scraping 18 nodes every 15 seconds, it was at 94% capacity.
When it hit 100%, every scrape started failing silently. All targets showed as DOWN. Every dashboard went red. The entire stack looked broken when the actual problem was a full disk.
The fix was resizing the container disk from 3.86GB to 14GB in Proxmox a 5-minute operation. But the diagnosis took longer because the error wasn’t obvious.
Rule of thumb: Size your Prometheus storage at 20GB minimum for a setup this size. Add more if you extend retention beyond 30 days.
2. Docker bridge networking will block your exporters
Blackbox Exporter and Unpoller run in Docker containers. Docker’s default bridge networking isolates containers from the host network which means they can’t reach your internal VLAN IPs without extra configuration.
The symptom: connect: no route to host on every internal target. The fix: --network host on the docker run command. One flag, immediately fixed. Should have been obvious. Wasn’t.
3. UniFi rate limiting is aggressive and not well documented
When I was repeatedly restarting the Unpoller container trying to debug the networking issue, the UniFi controller started returning 429 Too Many Requests on every authentication attempt. It locked out all auth attempts for several minutes at a time and kept resetting the timer every time I restarted the container.
The fix: stop the container completely, wait 10-15 full minutes without any connection attempts, then restart once with the correct config. Don’t touch it while it’s locked out. The rate limit resets from the last attempt, not from when it started.
4. Match your scrape timeout to your exporter’s collection time
After the UniFi rate limiting cleared, Unpoller was taking 3-5 minutes per collection cycle while recovering. Prometheus has a default scrape timeout of 10 seconds. Every scrape attempt was timing out before Unpoller finished collecting causing it to show as permanently DOWN even though it was actually working.
Fix: override the timeout per job in prometheus.yml:
- job_name: "unifi-exporter"
  scrape_interval: 120s
  scrape_timeout: 90s
  static_configs:
    - targets:
        - "10.10.30.140:9130"
Prometheus lets you set these per job. Use it. Don’t change the global settings for one slow exporter.
The Public Dashboard
One of my goals was making the NOC publicly accessible useful for portfolio purposes and for demonstrating the system in interviews without handing someone my credentials.
Grafana 12 has a Share externally feature that generates a public URL for any dashboard. The catch: it requires root_url to be set correctly in grafana.ini, otherwise it generates a localhost URL that doesn’t work externally.
[server]
root_url = https://grafana.cedshomelab.com
One line in the config, restart Grafana, and the public URL generates correctly. Simple fix, not obvious if you’ve never hit it before.
The live dashboard is available at noc.chasedumphord.com no login required, real data, auto refreshes every 30 seconds.
Why This Matters Beyond the Homelab
There’s a huge difference between “I watched a video about Grafana” and “I built and operate my own monitoring environment with 8 exporters, 3 production dashboards, and learned why my entire stack went red at 2am.”
That experience directly translates to production work. The same observability patterns I built here are the same patterns used in enterprise environments, SRE teams, DevOps workflows, and industrial monitoring systems. I know this because I apply them at GE Aerospace too.
Building a monitoring stack you actually care about keeping alive teaches you things no certification can. Especially the 2am lessons.
What’s Next
The observability stack is solid but there’s more to build:
- Alerting Grafana alert rules feeding into Discord or Telegram so I find out about problems before I find out about problems
- Log aggregation Loki for centralized log collection across all nodes
- Long term storage InfluxDB or a remote Prometheus write target for metrics beyond local retention
- Automated remediation self healing infrastructure that restarts failed services automatically
Each of these is a future post.
All configs and dashboard JSON exports are in the ceds-observability-stack repo on GitHub.
🔗 Links: